Glacier and ice sheet models
I'm involved in the application and/or development of the following models. Please get in touch if you'd like to collaborate/develop one of them.
I'm involved in the application and/or development of the following models. Please get in touch if you'd like to collaborate/develop one of them.
- ISSM (Ice-sheet and Sea-level System Model). Open-source, higher-order numerical model tailored to simulate past and future contributions of ice sheets to sea-level rise, as well as glacier dynamics, iceberg calving, basal motion, data assimilation, etc).
- IGM (Instructed Glacier Model). Open-source Python package, which permits to simulate 3D glacier evolution accounting for the coupling between ice thermo-dynamics, surface mass balance, and mass conservation.
- PyGEM (Python Glacier Evolution Model). Numerical model in Python that models the transient evolution of glaciers worldwide.
- Flowline models (developed by A. Vieli and F. Nick). Marine-terminating glaciers, calving, fjords, idealised setups.
Research projects
Natural and societal consequences of climate-forced changes of Jostedalsbreen Ice Cap (JOSTICE)
|
Postdoctoral researcher, University of Oslo
2021 - Ice-flow modelling of the future of the largest glacier in mainland Europe, Jostedalsbreen Ice Cap. JOSTICE's objective is to assess present and future changes in mass balance, runoff, ice volume and local climate of Jostedalsbreen, and determine the societal impact of these changes for hydropower, tourism and agriculture. |
|
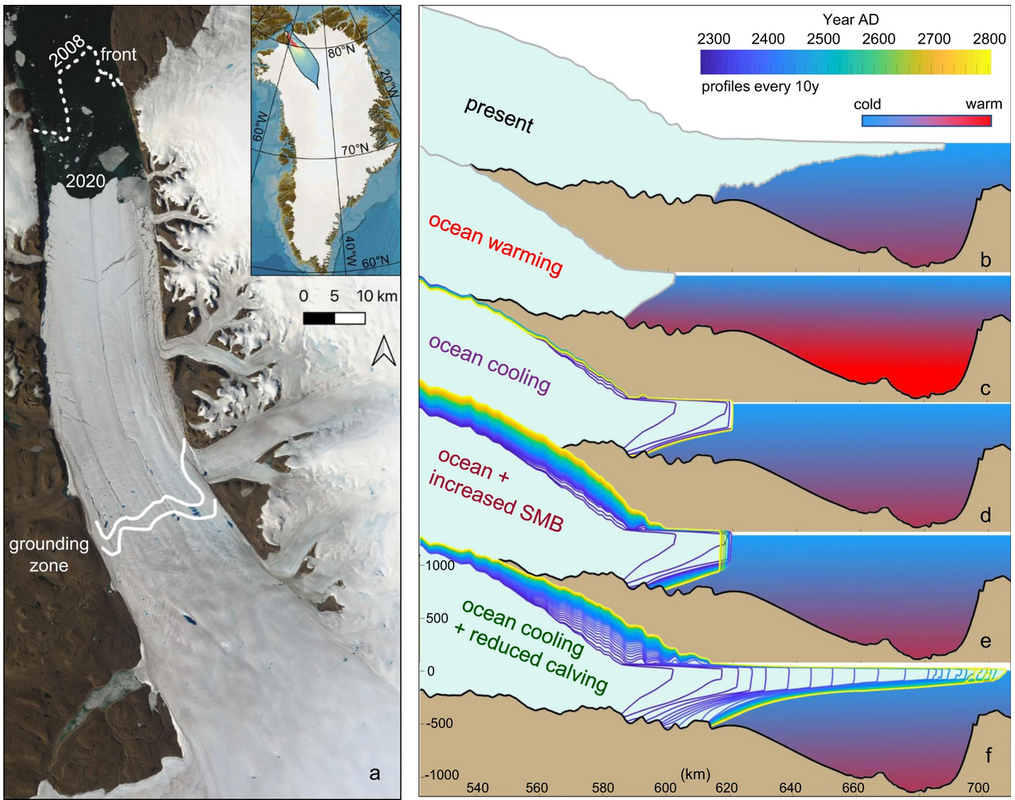
Dynamics and future of northwestern Greenland Ice Sheet
|
Postdoctoral researcher, Stockholm University and Bolin Centre for Climate Research
2018 - 2021 Combining ice sheet modelling with geological, oceanographic and climatic data to understand the dynamics and history of the northwestern part of the Greenland Ice Sheet. Publications Åkesson, H., Morlighem, M., Nilsson, J., Stranne, C., Jakobsson, M. Petermann ice shelf may not recover after a future breakup. Nat Commun 13, 2519 (2022). https://doi.org/10.1038/s41467-022-29529-5 [Web] [PDF] Åkesson, H., Morlighem, M., O’Regan, M., & Jakobsson, M. (2021). Future projections of Petermann Glacier under ocean warming depend strongly on friction law. Journal of Geophysical Research: Earth Surface, 126, e2020JF005921. https://doi.org/10.1029/2020JF005921 [Web] [PDF] Jakobsson, M., Mayer, L.A., Nilsson, J. ... Åkesson, H. ... Ryder Glacier in northwest Greenland is shielded from warm Atlantic water by a bathymetric sill. Commun Earth Environ 1, 45 (2020). https://doi.org/10.1038/s43247-020-00043-0. [Web] [PDF] |
|
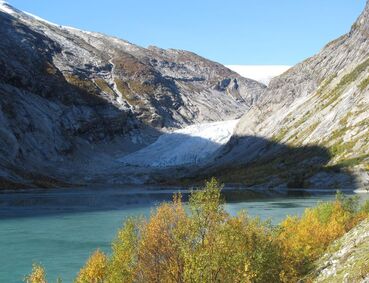
Deglaciation of the Norwegian fjords
|
PhD project 2014-2017
part of the Eurasian Ice Sheet and Climate Interactions (EISCLIM) project Åkesson, H. (2018). Deglaciation of the Norwegian fjords. PhD Thesis, University of Bergen. [Web] [PDF] [PhD defense press release (in Norwegian)] Trial lecture: Past, present and future sea-level changes in the context of regional and global ice dynamics (5 Dec 2017). - defended: Jan 9, 2018 - opponents: Andreas Vieli (Univ. Zürich), Chris Stokes (Durham Univ.) - committee: Andreas Vieli (Univ. Zürich), Chris Stokes (Durham Univ.), Atle Nesje (Univ. Bergen) - advisors: Kerim H. Nisancioglu (Univ. Bergen), John Inge Svendsen (Univ. Bergen), Mathieu Morlighem (Univ. California, Irvine) 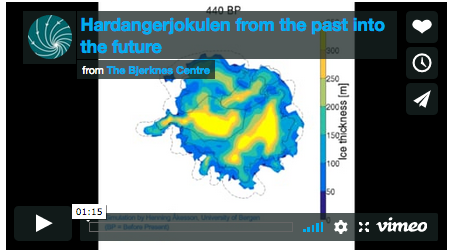
The rise and fall (?) of Hardangerjøkulen ice cap, southern Norway - what happened in the past, and what does the future hold? (video link).
|
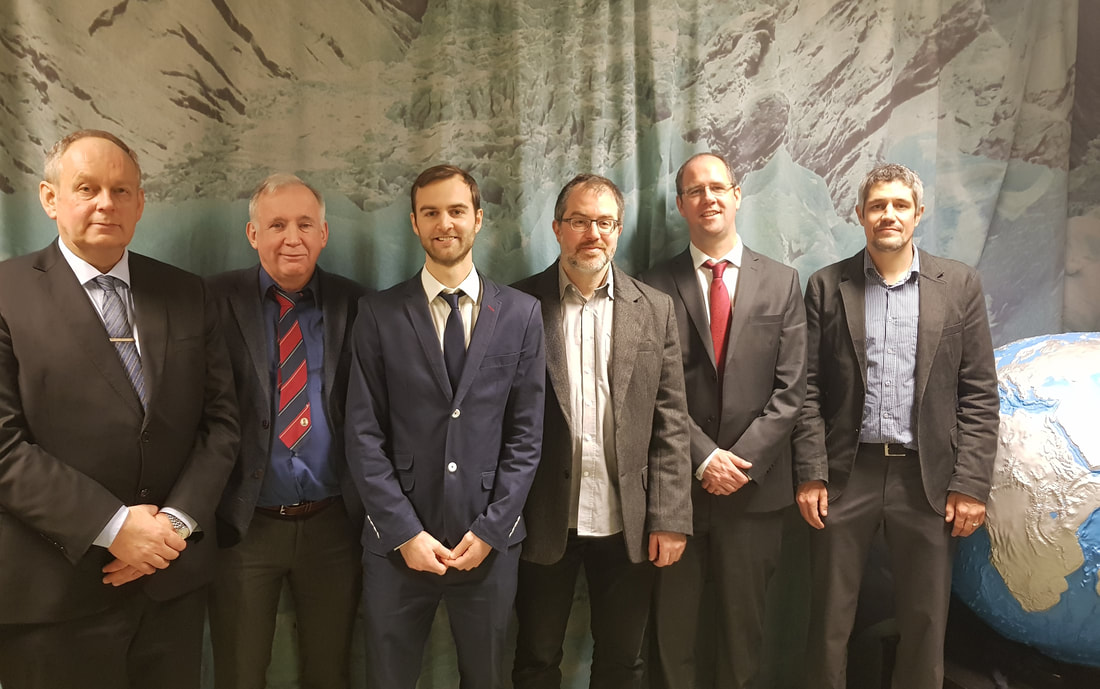
From left: Atle Nesje (member of evaluation committee), John Inge Svendsen (co-supervisor), the new doctor Henning Åkesson, Kerim H. Nisancioglu (main supervisor), Chris R. Stokes (opponent), Andreas Vieli (opponent). Not in picture: Mathieu Morlighem (co-supervisor).
|
|
Papers within thesis
Paper I Åkesson, H., Nisancioglu, K. H., Giesen, R. H., and Morlighem, M.: Simulating the evolution of Hardangerjøkulen ice cap in southern Norway since the mid-Holocene and its sensitivity to climate change, The Cryosphere, 11, 281-302, doi:10.5194/tc-11-281-2017, 2017. [Web] [PDF] Paper II Åkesson H, Nisancioglu KH and Nick FM (2018) Impact of Fjord Geometry on Grounding Line Stability. Front. Earth Sci. 6:71. doi: 10.3389/feart.2018.00071. [Web] [PDF] Paper III Åkesson, H., Gyllencreutz, R., Mangerud, J., Svendsen, J.I., Nick, F.M., Nisancioglu, K.H. (2020). Rapid retreat of a Scandinavian marine outlet glacier in response to warming at the last glacial termination. Quat. Sci. Rev. 250, https://doi.org/10.1016/j.quascirev.2020.106645. [Web] [PDF] Paper IV Steiger, N., Nisancioglu, K. H., Åkesson, H., de Fleurian, B., and Nick, F. M.: Simulated retreat of Jakobshavn Isbræ since the Little Ice Age controlled by geometry, The Cryosphere, 12, 2249-2266, https://doi.org/10.5194/tc-12-2249-2018, 2018. [Web] [PDF] Paper V. Åkesson, H., Morlighem, M., Nisancioglu, K. H., Svendsen, J. I., & Mangerud, J. (2018). Atmosphere-driven ice sheet mass loss paced by topography: Insights from modelling the south-western Scandinavian Ice Sheet. Quaternary Science Reviews, 195, 32-47. [Web] [PDF] 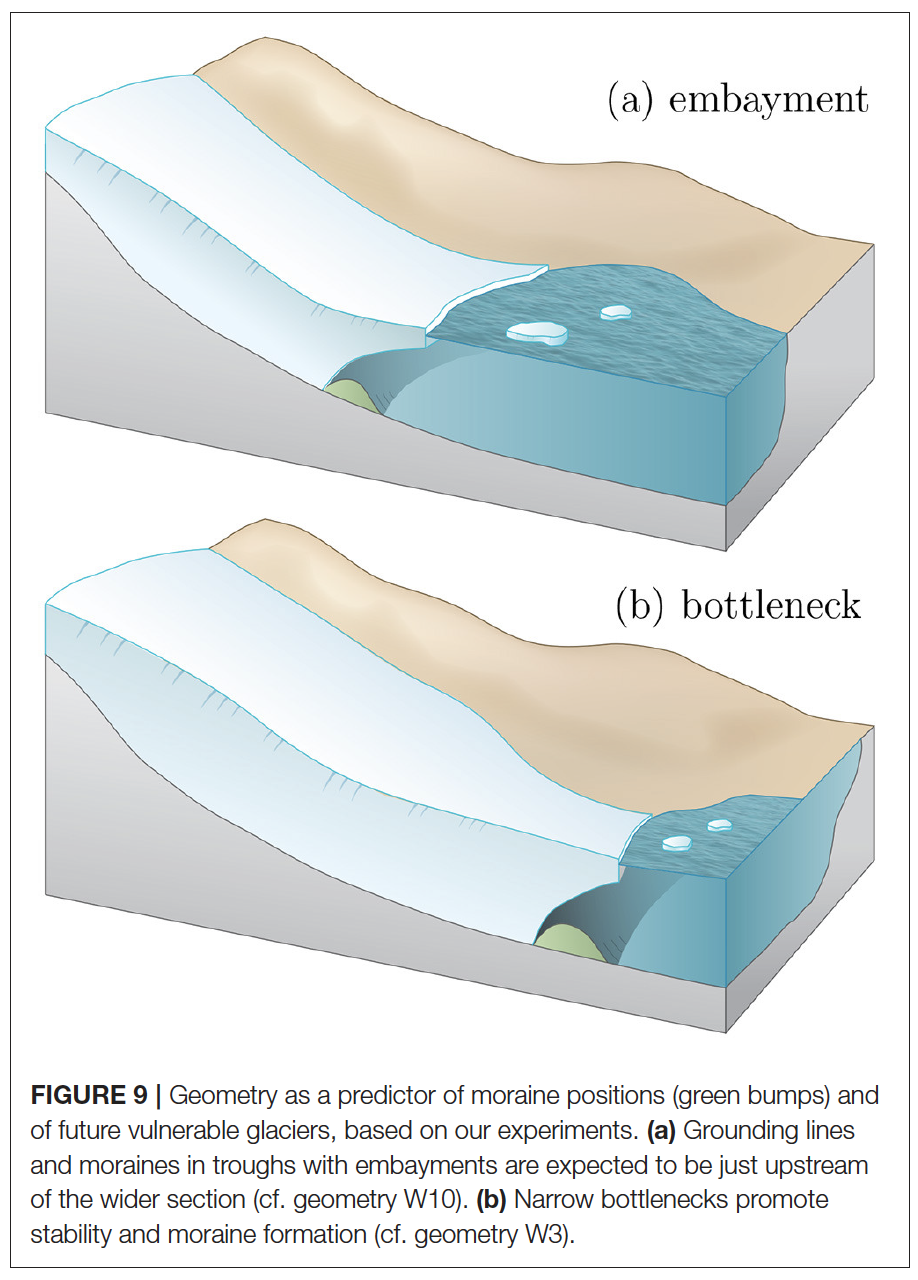
From Paper II: Impact of fjord geometry on grounding line stability. Åkesson et al. 2018 Frontiers of Earth Science: Cryosphere
Popular science summary
The Norwegian fjord landscape conceals abundant clues of the behaviour of glaciers of the past, and how fast they melted away. In his PhD thesis, Henning Åkesson shows that the glaciers in western Norway during the last glacial period were extremely sensitive to climate change. Similarly, the glaciers currently present in the Norwegian landscape are also about to melt away. Åkesson used computer models and geologic evidence to study glaciers of the present-day and the last glacial period in Norway and Greenland. The thesis closely examines Norway’s sixth largest glacier; Hardangerjøkulen ice cap. Today’s ice cap does not consist of ice remaining from the last glacial period, but was built up over the last several thousand years. Åkesson shows that this ice cap is exceptionally sensitive to a warmer climate. Melting of Hardangerjøkulen brings challenges to the hydropower and tourism industry alike. Plants and animals living in the vicinity of the glacier are also forced to adapt to a changing landscape and waning meltwater from the glacier. The thesis also considers the glaciers of coastal western Norway during the last glacial period. These ‘fjord glaciers’ are particularly vulnerable to climate change, since a warming atmosphere and ocean melt the ice from both above and below. The glaciers that once dominated the Norwegian fjord landscape are close cousins to the glaciers that today inhabit the fringes of the Greenland Ice Sheet – glaciers that now are melting at an increasing rate. The fjord glaciers in western Norway melted away around 11,000 years ago; when will this happen to their cousins in Greenland? Glaciers melt in a warming climate, but they follow different patterns. Some glaciers are immensely sensitive, while others still are stable over long periods of time, before suddenly retreating rapidly in response to a warming. This knowledge is vital when we seek to understand how climate change affects our glaciers. Åkesson’s work shows that predictions of ice sheet melt in Greenland and Antarctica, with associated sea level rise, can be improved by studying the glaciers covering the Norwegian coast during the last glacial period. When it comes to Hardangerjøkulen, this ice cap will likely melt away completely before the end of the 21st century, should the current warming continue. The EISCLIM project (2014-2017) My PhD project was a part of the EISCLIM project, which focused on the style of growth and decay of the Eurasian ice sheet, and what forcings were responsible for these changes. EISCLIM comprised geological reconstructions and modelling of climate and ice dynamics on both the ice sheet wide and regional scales. Key partners in this project were Kerim H. Nisancioglu, John Inge Svendsen, Jan Mangerud, Anna Hughes, Kristian Vasskog, Jostein Bakke (all University of Bergen and Bjerknes Centre for Climate Research), Lev Tarasov (Memorial University of New Foundland), Nina Kirchner, Richard Gyllencreutz (both Stockholm University), Faezeh Nick (University centre in Svalbard), Jason Briner (State University of New York at Buffalo) and Brent Goehring (Purdue University). EISCLIM was funded by the Norwegian Research Council. |
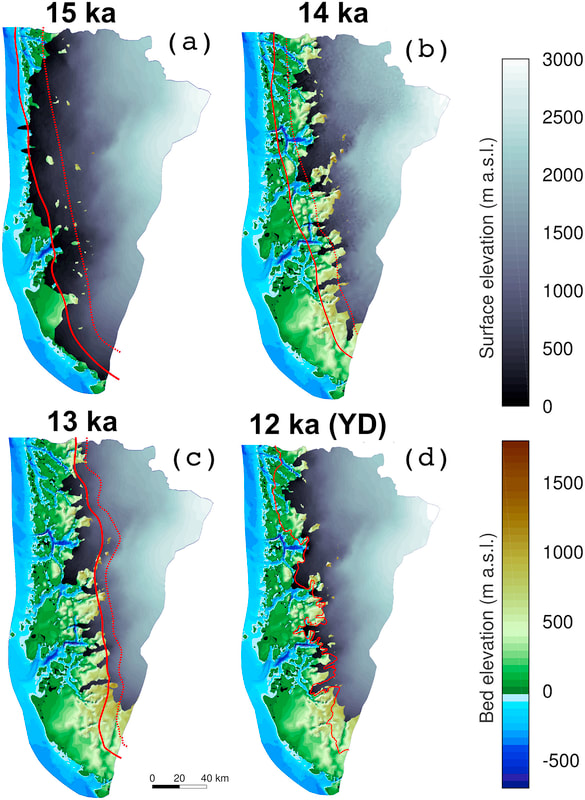
Modelled ice sheet geometry at (a) 15 ka, (b) 14 ka, (c) 13 ka (Allerød), and (d) 12 ka (Younger Dryas). For each time-slice, red solid and dotted lines represent maximum and minimum extent from geological reconstructions (Briner et al., 2014; Hughes et al., 2016; Gump et al., 2017; Mangerud et al., 2017).
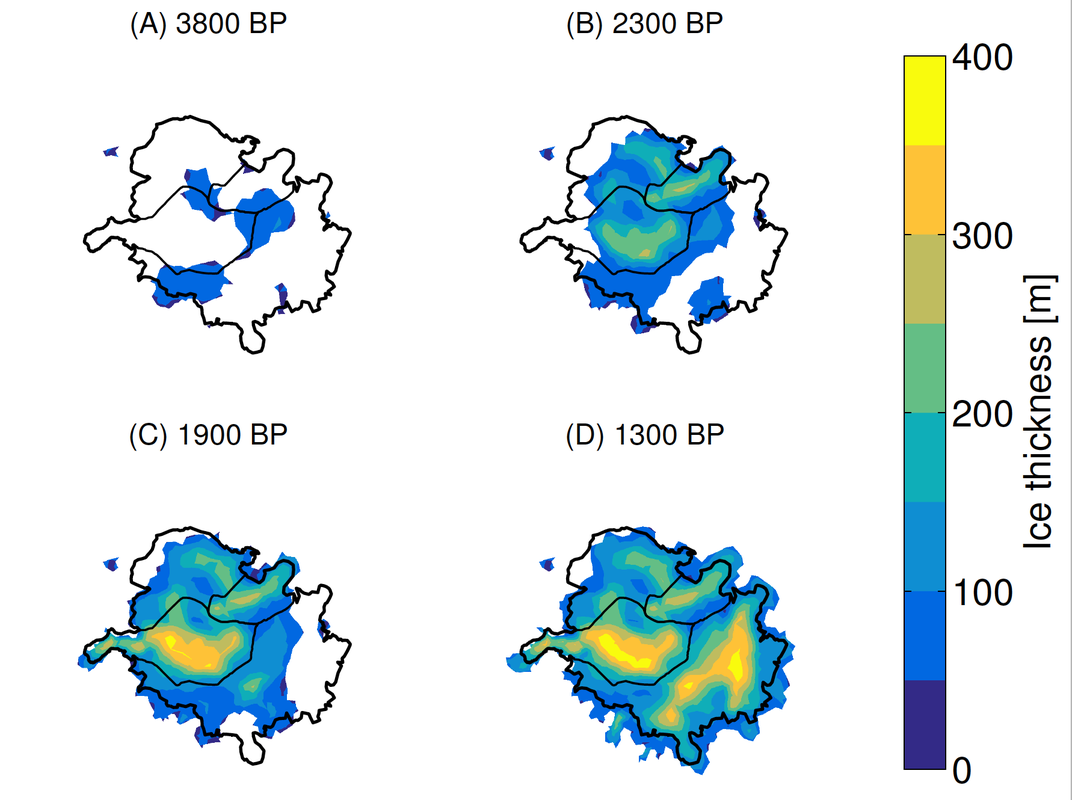
Figure 5. Modeled ice thickness at (a) 3800, (b) 2300, (c) 1900 and
1300 BP using our “best-fit” model parameters obtained from independent
calibration. Shown are also ice cap extent in AD1995
(black thick line) and corresponding drainage basins for outlet
glaciers Rembesdalskåka (SW) and Midtdalsbreen (NE; black thin
lines).
From Paper I: Åkesson et al. 2017, The Cryosphere
PhD thesis scientific abstract
Melting glaciers and ice sheets are perhaps the most visible signs of a warming climate. Glaciers are retreating on every continent, ice sheets are shedding icebergs into a warming ocean at an accelerating rate, and the atmosphere melts more ice as temperatures rise. Despite these lines of evidence, and a growing scientific and public attention to melting ice; we are still not able to present robust numbers of future sea level rise. While the overall picture is one of retreat and meltdown, complex patterns arise when we zoom in within a certain region. The geologic record testaments both collapse and periods of growth, and provides important clues to future mass loss. However, these records show that variable responses were present within regions exposed to the same climate forcing. This is also found in Greenland and Antarctica today, where observations reveal that neighbouring glaciers respond differently to the same climate warming. Caution is therefore needed when explaining the responses of these glaciers. The instrumental record helps us improve process understanding, yet is unable to assess changes over time scales longer than a few decades. The geologic record provides a longer perspective, but is not able to resolve short-lived variations. This time scale issue is critical because we need to understand both the short-term and long-term response to improve understanding of glacier and ice sheet dynamics and their sensitivity to climate change. In this thesis, we use a suite of numerical model tools combined with geological data to assess how external forcing triggers and drives short- and long-term change. Equally important, we study how site-specific factors such as topography can prevent, delay, dampen, amplify, and override the ambient forcing. We assess theoretical cases as well as past and present glaciers in Norway and Greenland, with the goal to answer the overarching question: how do glaciers and ice sheets respond to climate change? We move from the sensitivity of a Norwegian ice cap to Holocene climate change in Paper I, via the impact of fjord geometry on grounding line stability in Paper II, to the abrupt retreat of the nearby Hardangerfjorden glacier during the Younger Dryas cold period in Paper III. We continue with the most active glacier in Greenland in Paper IV, and finish with a comprehensive study of the triggers and drivers of the deglaciation of the Norwegian fjords in Paper V. For marine-terminating glaciers, we find that grounding line dynamics and ice-ocean interactions are fundamental over time scales up to a century or two. Beyond this time frame, changes to the surface mass balance are likely to drive widespread, multi-centennial to millennial scale deglaciation. Based on the results presented in this thesis, we also suggest that topography is a factor that cannot be ignored. Once triggered, the response to climate change is to a large degree controlled by the underlying bed topography of ice caps (Paper I), and by the fjord bathymetry and width of marine-terminating glaciers (Papers II–V). The implications are that continued intense studies of warming seas around Greenland and Antarctica are justified, but also that assessments of atmospheric-induced melt will be important to estimate long-term sea level change. The striking impact of topographic factors found in this thesis also shows a potential to use geometry to predict future evolution and estimate past retreat and advance. |
Simulating the climatic response of Hardangerjøkulen ice cap in southern Norway since the Little Ice Age
 Model mesh used to model Hardangerjøkulen ice cap. Colours indicate present-day ice thickness, the solid line represent present-day ice margin and the dashed line the flowline of the largest outlet glacier, Rembesdalskåka.
MSc Thesis 2013-2014
I was using a numerical ice flow model (the Ice Sheet System Model, ISSM; Larour et al. 2012) to understand the climatic response and dynamics of the Hardangerjøkulen ice cap (73 km2) in southern Norway during the last 300 years. I investigated the effect of sliding parameterizations and the applicability of the Shallow Ice Approximation for small ice masses.
Using in incomplete description of ice flow, along with a simple implementation of mass balance, we were able to reproduce most of the observed and reconstructed glacier evolution from the Little Ice Age maximum in 1750 until today. We also found that the present-day Hardangerjøkulen ice cap is very sensitive to changes in mass balance. A shift in mass balance with only - 0.15 m water equivalents relative to the mean mass balance during the last 45 years will cause almost the entire ice cap to disappear.
This thesis was defended 11 June 2014 and graded A (scale A-F).
References
Larour, E., Seroussi, H., Morlighem, M., & Rignot, E. (2012). Continental scale, high order, high spatial resolution, ice sheet modeling using the Ice Sheet System Model (ISSM). Journal of Geophysical Research: Earth Surface (2003–2012), 117(F1).
Åkesson, H. (2014). Simulating the climatic response of Hardangerjøkulen in southern Norway since the Little Ice Age. MSc Thesis, University of Bergen. PDF
